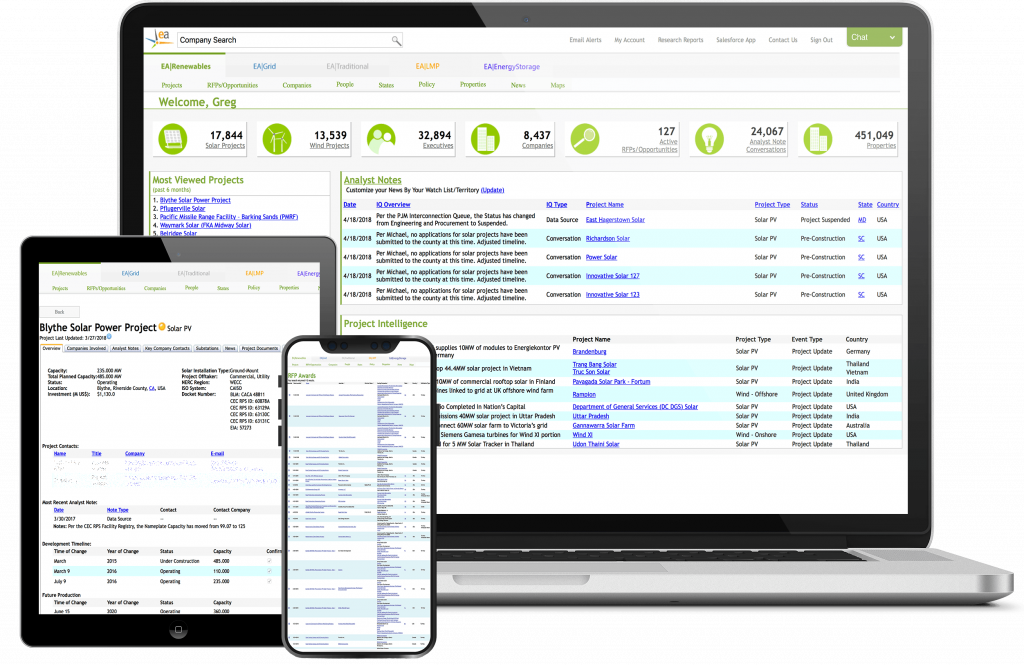
Since Energy Acuity’s inception in 2008, we’ve tracked and analyzed over 5,900+ active Solar ‘Request for Proposals’ (RFPs). Over the past 5 years, we’ve seen Solar RFP growth of 21.6% Year-over-Year. Let’s dive in and answer some crucial questions needed to analyze the Solar RFP Market:
1.) How are Solar RFPs trending?
2.) Which companies are issuing Solar RFPs?
3.) Over the past 5 years, which states have the most Solar RFPs?
4.) Historically, which months have the largest amount of RFPs been released?
Source: Energy Acuity Solar RFPs & Opportunities
How are Solar RFPs trending?
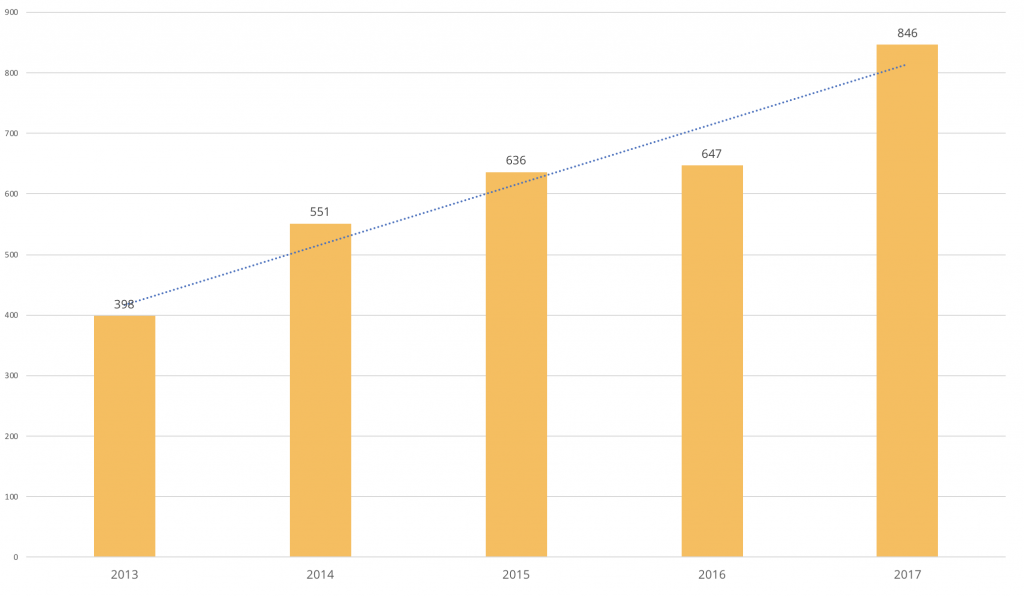
Key Trends:
✔️ Solar RFPs have seen an average of 21% growth year-over-year from 2013 to 2017.
✔️ Despite slow growth from 2015 to 2016 (1.73%), Solar RFPs saw a 30% bump the next year.
✔️ 2018 YTD, Solar RFPs are outperforming 2017-to-date by 7.38%.
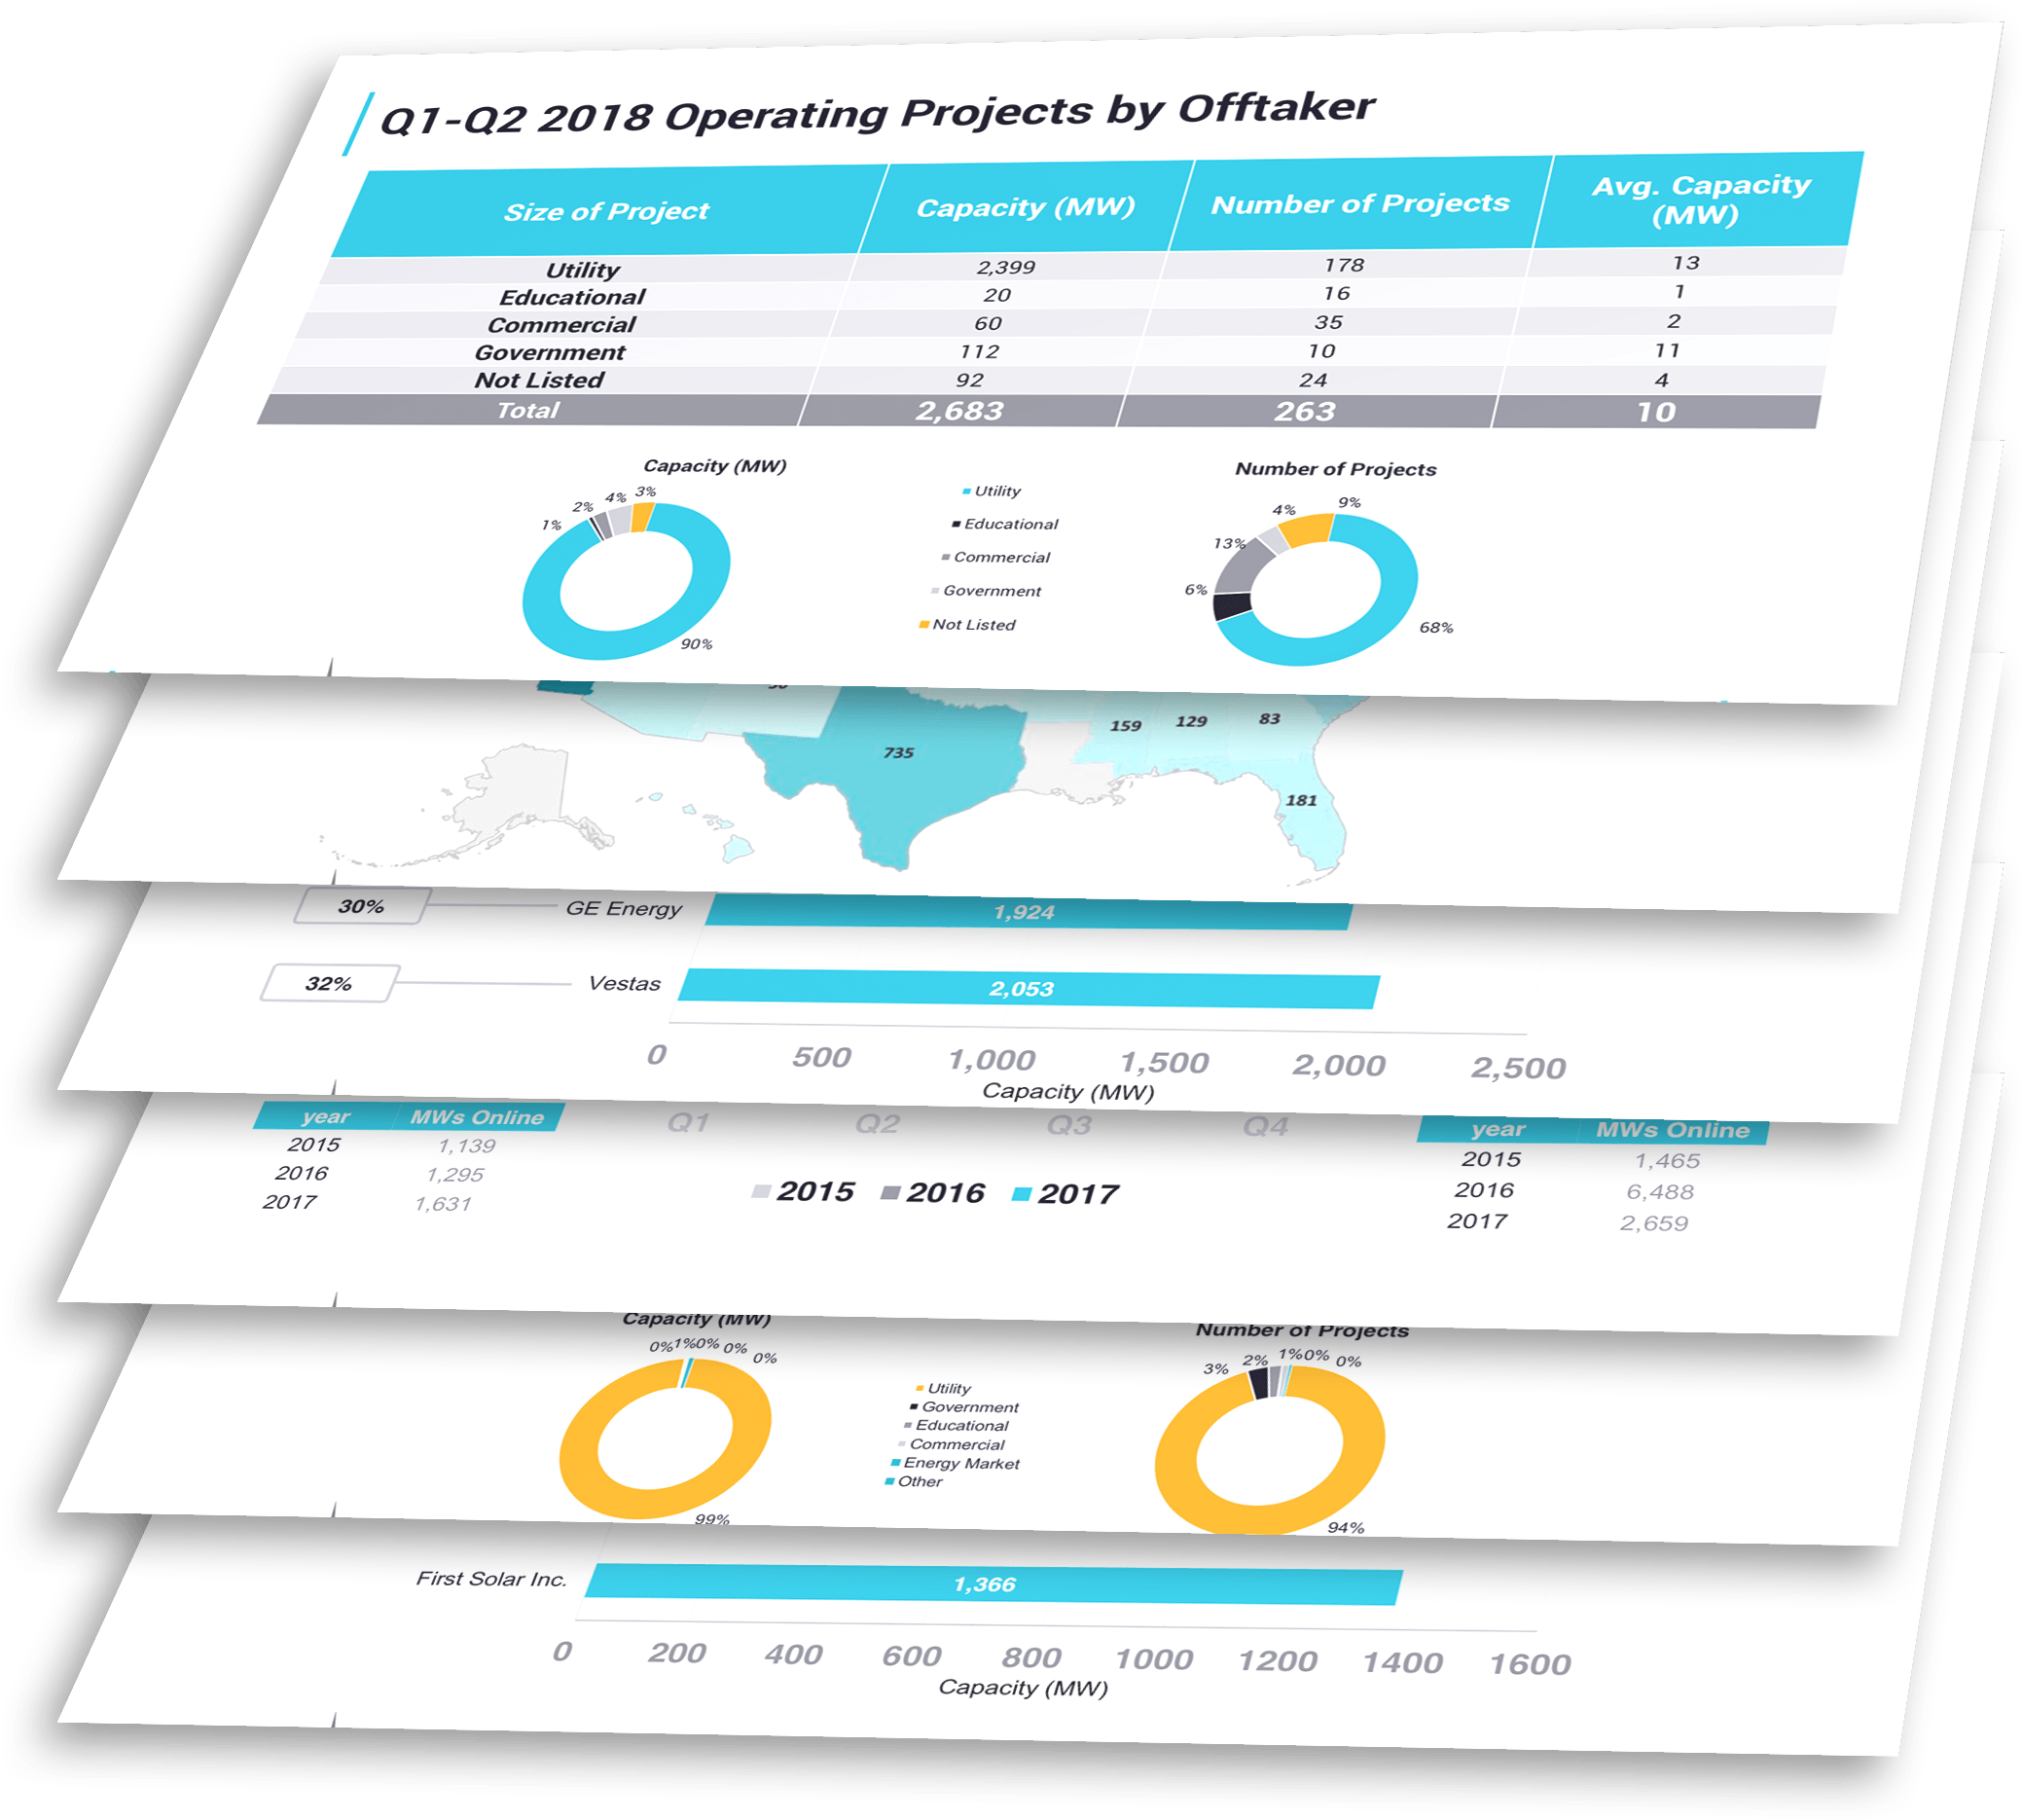
2.) Which companies are issuing the largest majority of Solar RFPs in the past 5 years?
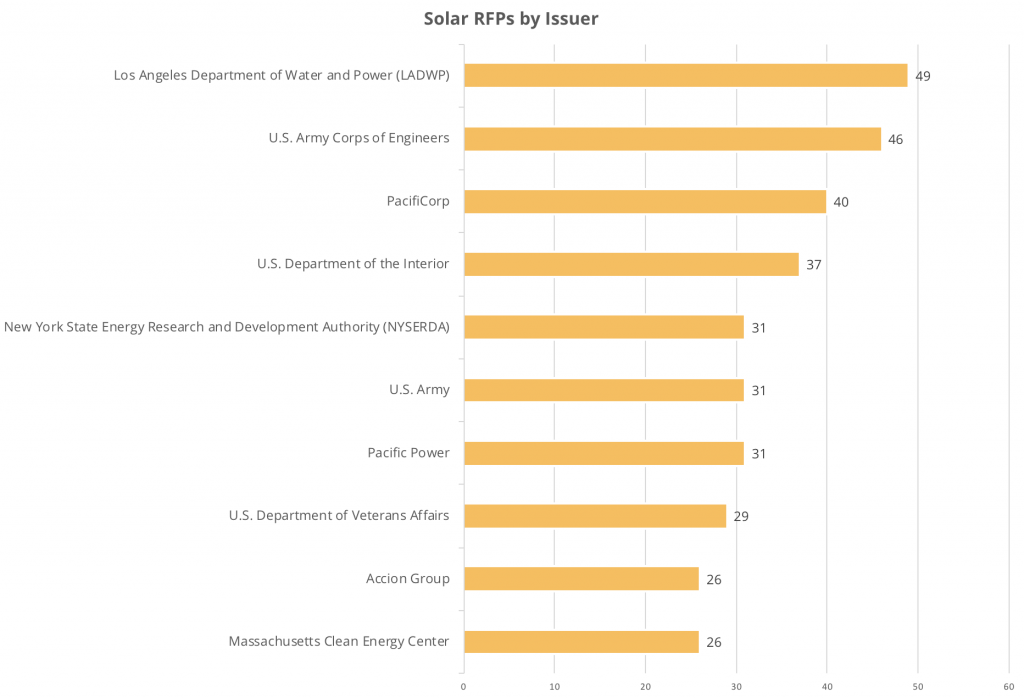
Key RFP Issuer Facts:
✔️ The top 10 Solar RFP issuers represent 9.6% of all Solar RFPs issued within the last 5 years.
✔️ Los Angeles Department of Water and Power (LADWP) has has historically been the largest issuer of solar RFPs.
3.) Over the past 5 years, which states have the most Solar RFPs?
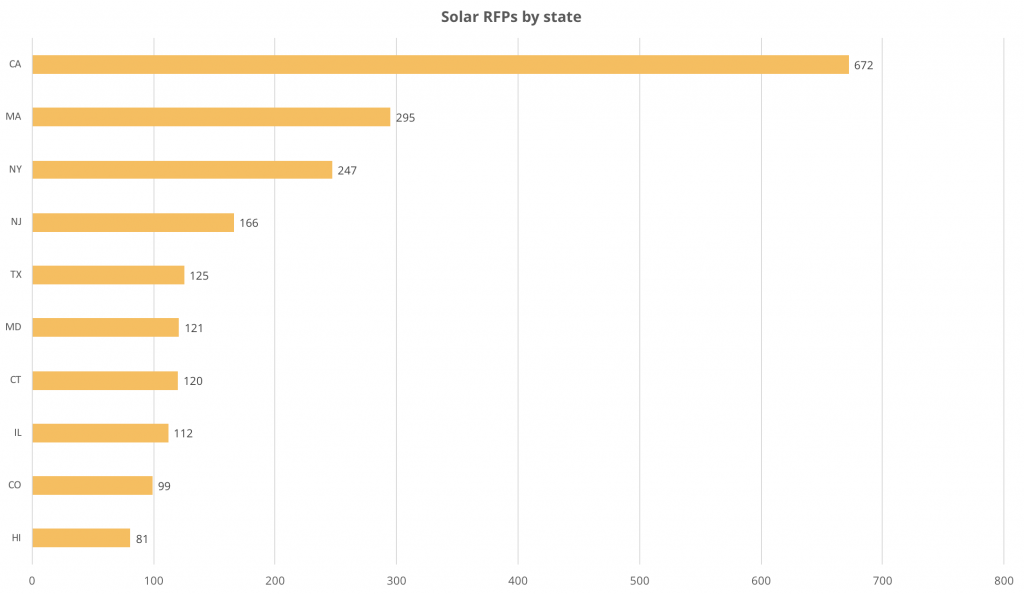
Key State Facts:
✔️ California represents 18.7% of all Solar RFPs issued within the last 5 years.
✔️ The Top 10 Solar RFP states represent 56.8% of all Solar RFPs issued within the last 5 years.
✔️ Massachusetts, New York, New Jersey, Maryland & Connecticut represent 26.5% of all Solar RFPs issued in the last 5 years.
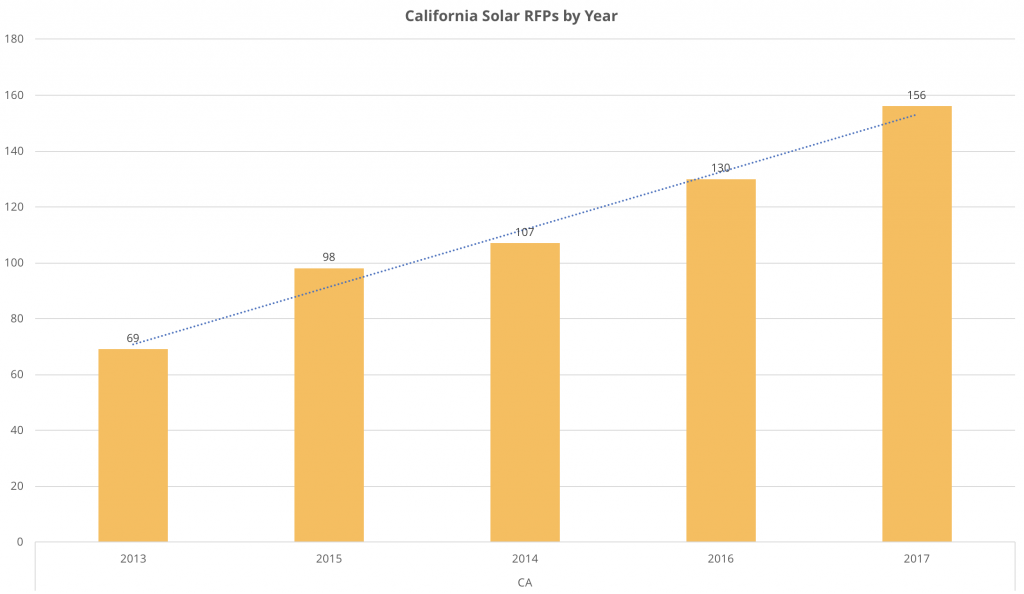
✔️ California has seen 5 years of continuous Solar RFP growth with an average growth rate of 23.2% year-over-year.
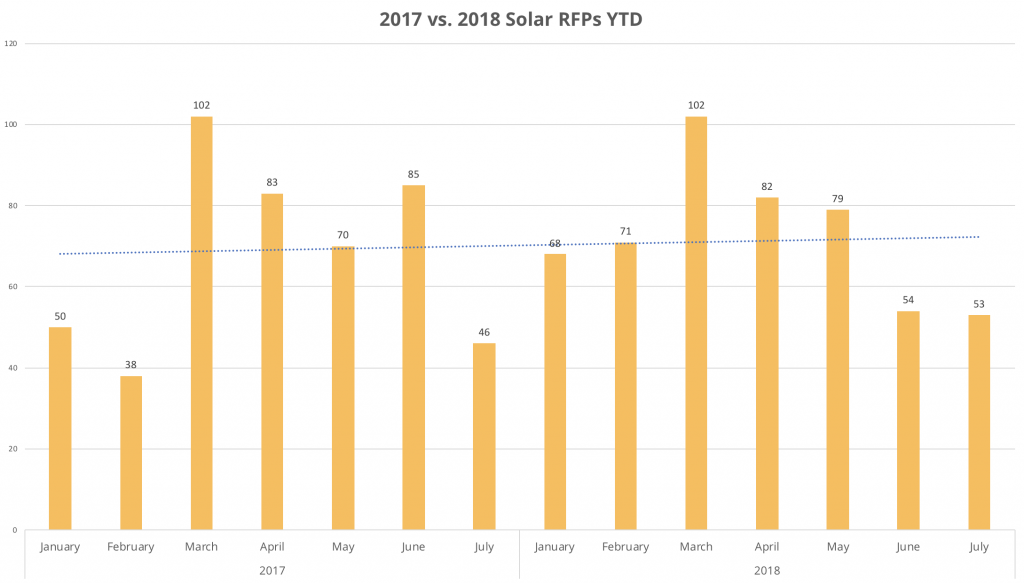
4.) Historically, which months have the largest amount of RFPs released?
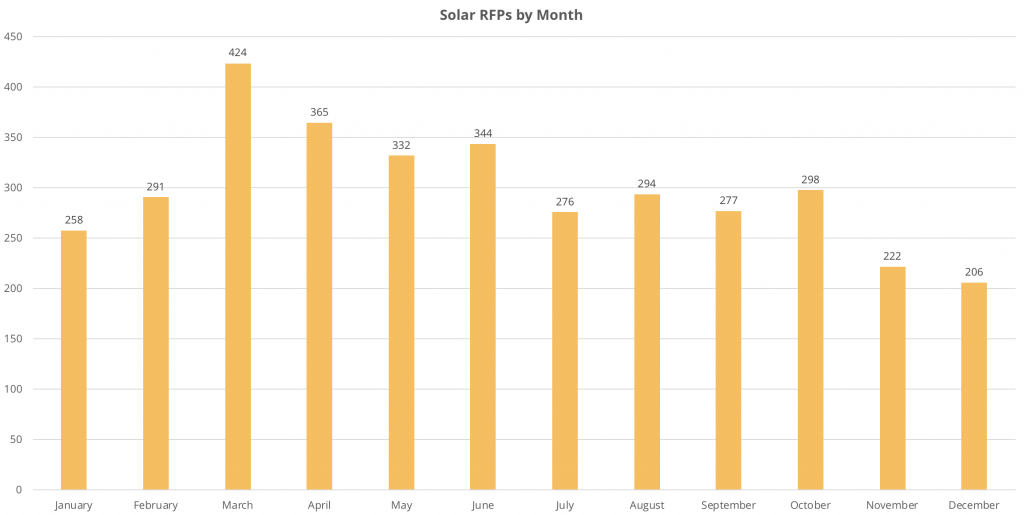
Key Month Facts:
✔️ Historically, Q2 is the most active period for Solar RFPs; representing 29% of all issued Solar RFPs over the past 5 years.
✔️ March represents 11.8% of all issued Solar RFPs over the past 5 years.
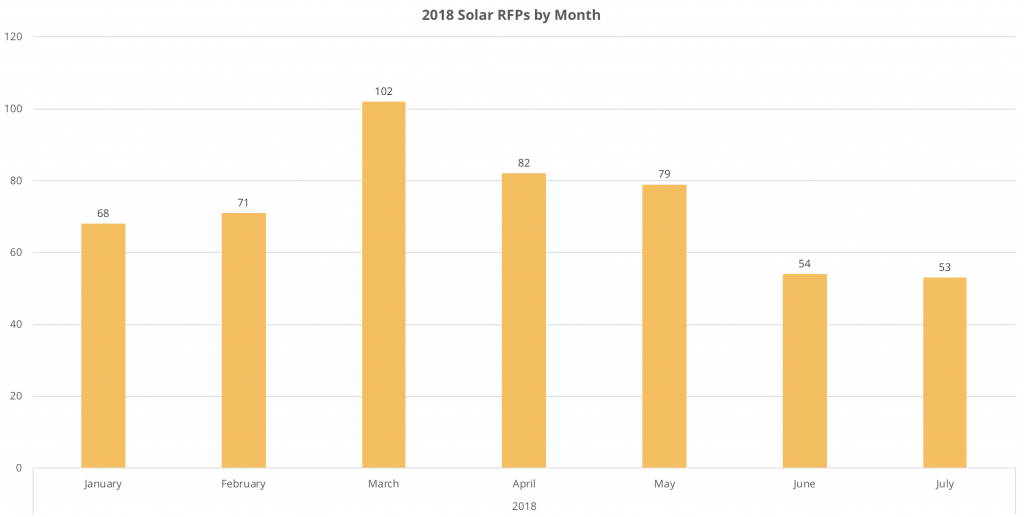
✔️ Expect to see similar trends for the second half of 2018.
✔️ 2018 YTD, March is the strongest month for Solar RFPs representing 20.0% of the total.
What can we expect going forward?
Currently we see no economic indicators that would suggest a decline in the current Solar RFP growth rate of around 20%. California will continue to be a dominant state for RFPs issued, with the east coast not far behind.
Source: Energy Acuity Solar RFPs & Opportunities
Need more Solar RFP information, analysis and insights? Demo the Energy Acuity Product Suite!