Enverus power market publications serve a large swath of power traders and utility professionals. From our granular twice-daily ISO updates to our bimonthly 90-day price forecasts, we are constantly innovating to bring our customers improved market insights.
Understanding the macro fundamentals behind power market price movement and congestion is essential for many of our customers, from power traders to solar farm owners. You don’t have to be a minute-by-minute real-time power trader to get the benefits from a deeper understanding of why ERCOT power prices moved the way they did during the previous week.
Now, the Enverus team that delivers twice-daily granular market updates and load forecasts is expanding to publish a weekly market analysis lookback that will include the following:
- Enverus price forecast analysis.
- Price map analysis.
- Congestion impacts on prices.
- Enverus/ISO load forecast analysis.
- Enverus/ISO peak load forecast errors.
- Enverus/ISO wind forecast analysis.
- Enverus/ISO solar forecast analysis.
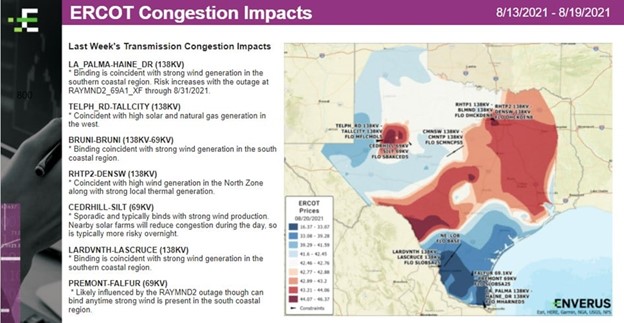
We’re most proud to unveil our new Congestion and Price Impacts analysis, which is now possible with the incorporation of Marginal Unit’s technology within the Enverus Power & Renewables product suite. This analysis includes a price map with the congestion points labeled on the map to illustrate how congestion is impacting wholesale power prices.
We have included a snapshot from our ERCOT and PJM reports. We’d love to give you a peak of the full report. Sign up on the form below to receive your complimentary copy.
Figure 1 | Snapshot of ERCOT Transmission Congestion Price Impacts
Sign up today for a free trial: